v. to pass to and fro upon, to frequent (a road, etc.); to traverse
n. The passing to and fro of persons, or of vehicles or vessels, along a road, railway, canal, or other route of transport
[adapted from the OED]
Bridges are built where the current shifts
from bank to band, as the river’s curve reverses.
There, foundations will be soundest,
at points like nodes held still
on a vibrating string.
[Alice Major, “Contemplating the City”]
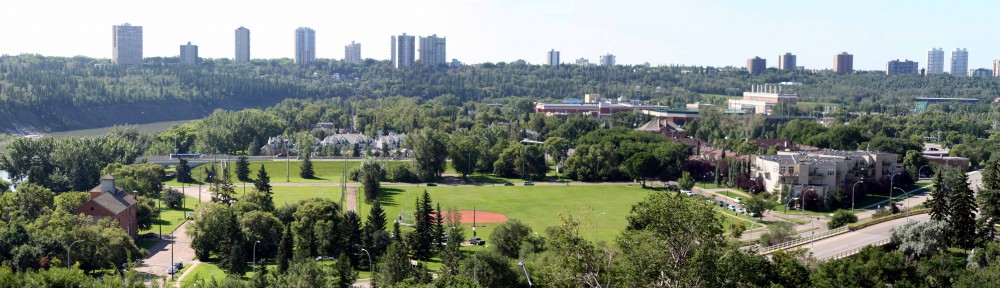
Traffic may include: Walter’s Ferry, EY&P Railroad, HBC Stables, reroute of Rossdale Rd, 105 st. bridge, bike trails, river valley footpaths
Thoughts on Form
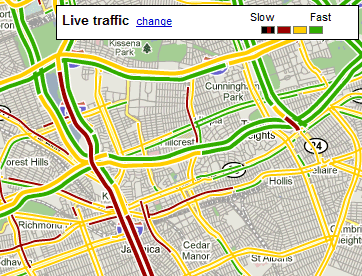
How is traffic mapped? One common method seems to be color coding by speed:
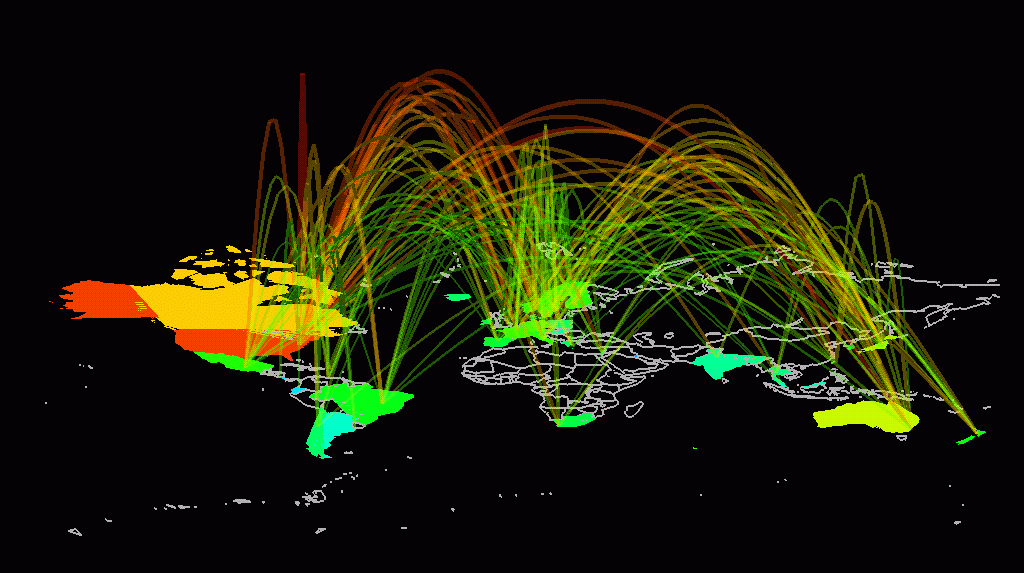
internet traffic maps necessarily focus more on destinations than routes:
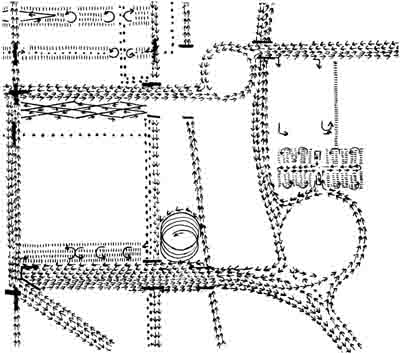
I envision traffic maps as something with arrows, reminiscent of the diagrams of a magnetic field:
How about this for some inspiration: a map that shows only the direction of the roads, in tiny arrows, but not the roads themselves? I like the dancing metaphor that Andy Woodruff suggests as well. We could feasibly colour code the arrows by type of traffic, and have them appear as separate objects/groups of objects in hypercities. Could clicking on the arrow make information about the type of traffic pop up?
Here’s another arrow-based traffic map:
for those with a rudimentary knowledge of physics, this may also be reminiscent of a vector field diagram:
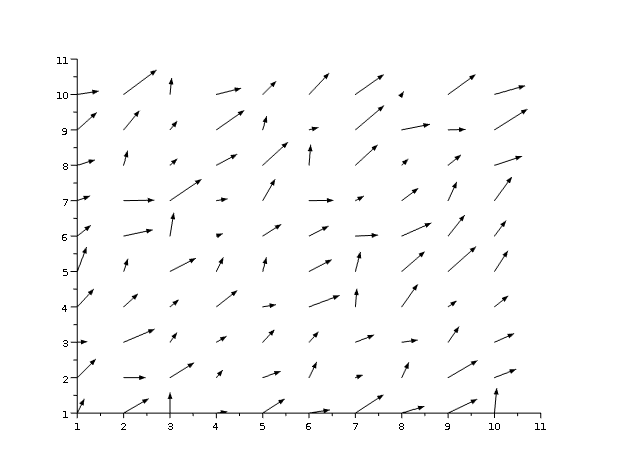
wikipedia on vector fields: “Vector fields can usefully be thought of as representing the velocity of a moving flow in space, and this physical intuition leads to notions such as the divergence (which represents the rate of change of volume of a flow) and curl (which represents the rotation of a flow).”
Sounds like traffic, doesn’t it?